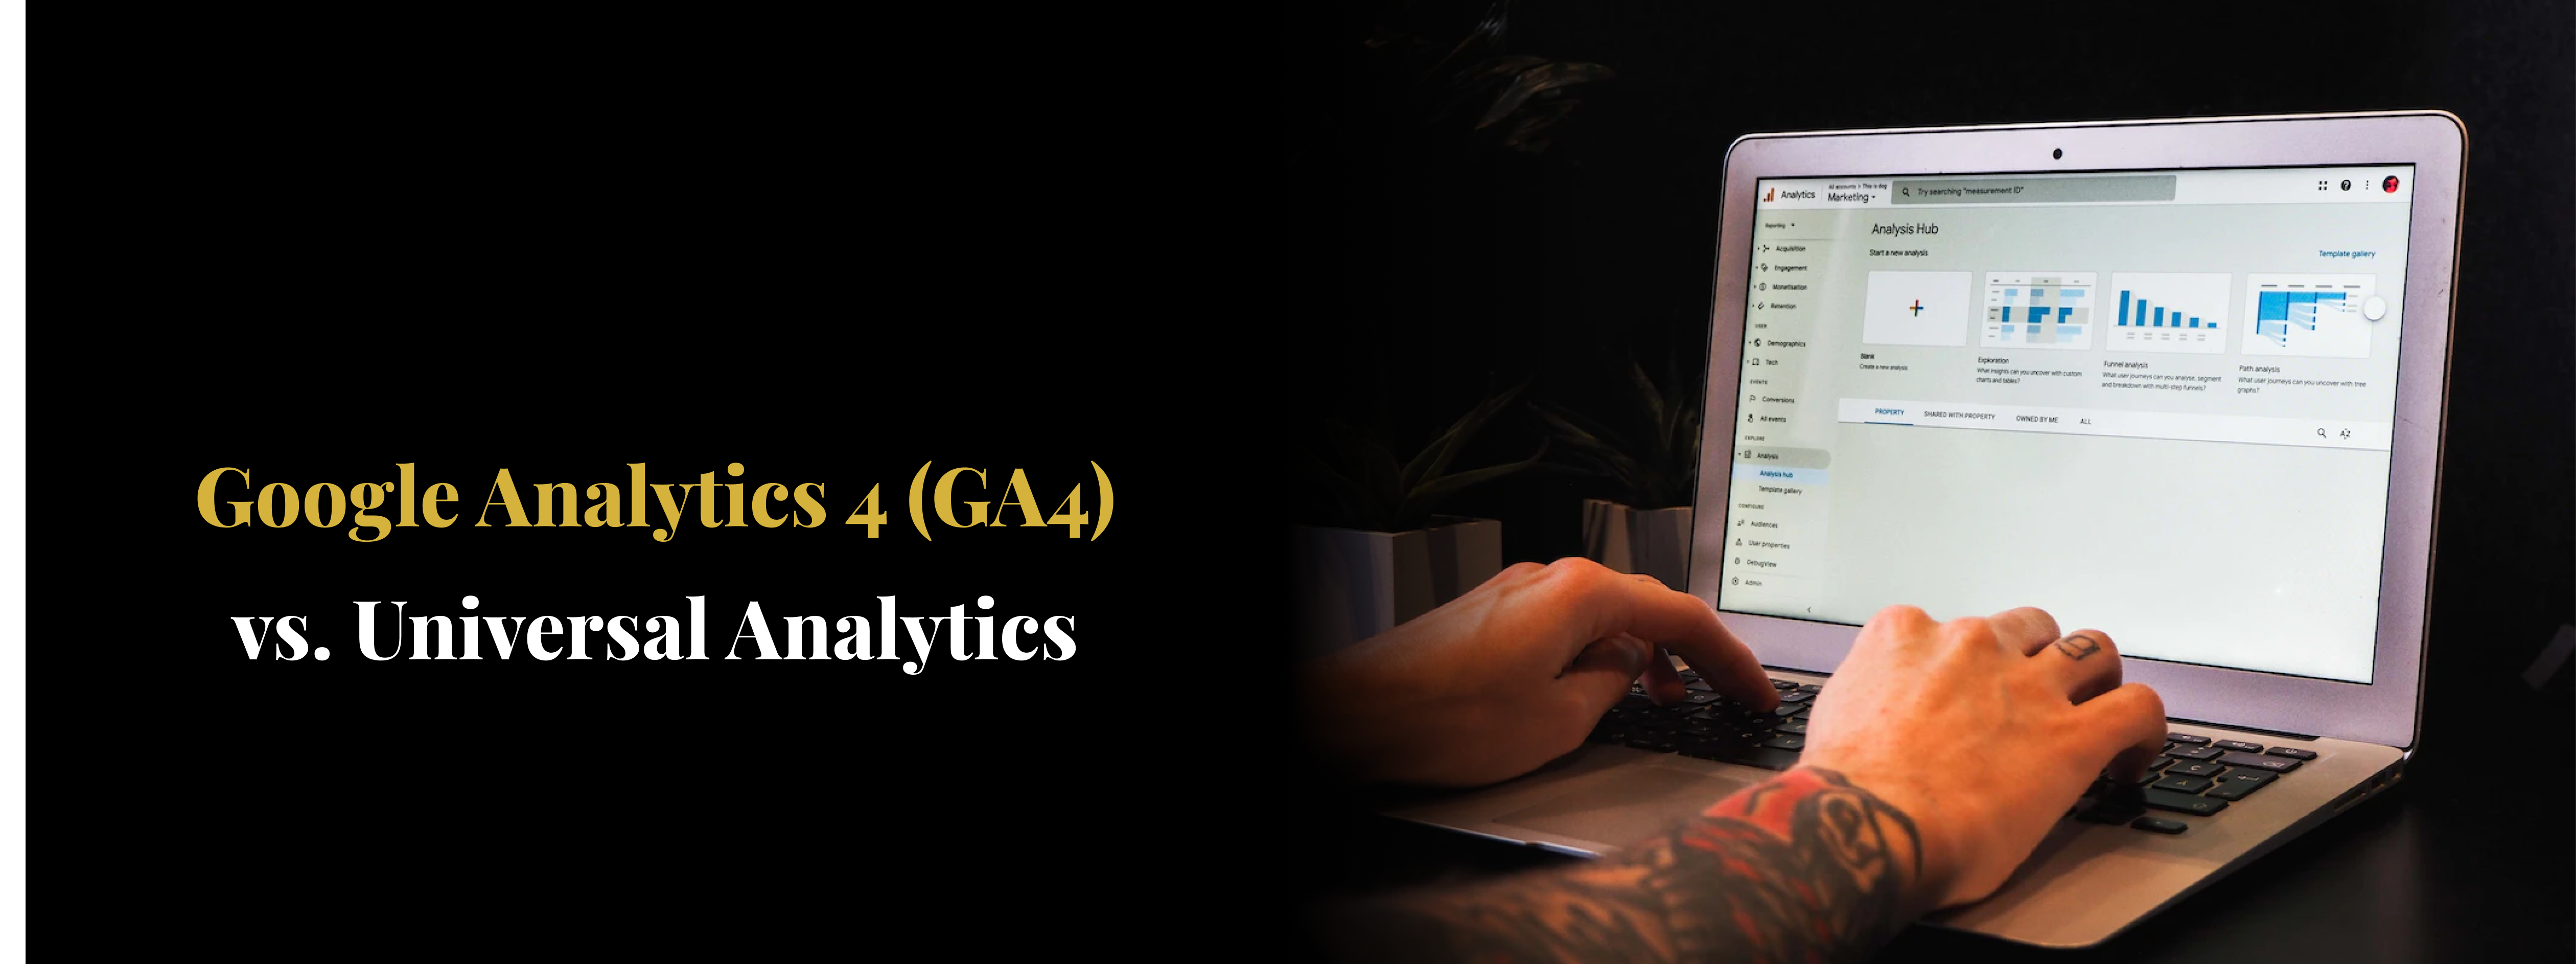
Google Analytics 4 (GA4) vs. Universal Analytics

Google recently reported that Universal Analytics (UA), a data collection and analysis program that has been providing user insights since 2012, will stop processing data on either July 1 or October 1, 2023, depending on if you have standard or 360 properties. Google recommends that Google Analytics users make the switch to Google Analytics 4 (GA4), their most recent iteration of data insights and analysis technology, before those dates to avoid a pause in service.
This change can be a frightening time for business owners and marketers alike, who are scrambling to understand the differences between the two programs. While there are a lot of significant changes that we will discuss in this article, there’s no need for panic! We’ve highlighted all of the major changes you need to know and how they will affect those relying on UA for their data processing.
What is Google Analytics 4?

Before getting into the finer details of the differences between UA and GA4, let’s take a closer look at GA4, Google’s newest analytics platform. In October 2020, Google released GA4, a new analytics program that focuses on event-based analytics, protecting privacy, utilizing machine learning models, and much more. For a more comprehensive overview on GA4, take a look at our latest article that breaks down everything you need to know about GA4.
Article Overview:
1. What is Google Analytics 4?
2. GA4 Performance Analytics & How They Impact Your Business
4. Types of Metrics GA4 Will Provide
6. How To View and Filter Data in GA4
7. How Will GA4 Impact E-Commerce Reports and Metrics?
8. What Predictive Analytics in GA4 Impact Data and Reporting?
9. What Does “User-Privacy” Focused Data Mean?
10. Does GA4 Collect User IP Addresses?
11. Enabling Google Signals for Reporting and Tracking
12. A Quick Recap…
13. Should You Migrate From UA to GA4?
14. How To Migrate Your Data From UA to GA4
GA4 Performance Analytics & How They Impact Your Business

1. Hits Vs. Events
If you’re familiar with Universal Analytics, you know most of its analytics measurements are based on “hits,” like page views, events, social, e-commerce, etc. Hits are defined by parameters like category, action, and label. Categories would define the name of a group of events, actions were the type of interaction measured, and labels were any additional information you wanted to add to provide context to a report. In GA4, however, everything is an event.

Before getting into what this means for your business and reports, here’s how sessions are triggered.
2. Session Triggers
In UA and GA4, Hits and Events happen in sessions (period of time a user is active on your site). In Universal Analytics, sessions are triggered when a new window is opened, there is re-engagement with the site after 30 minutes of inactivity, or a session carries from one day to the next. Additionally, a session can be triggered with a new campaign source – the way a user reaches your site.
In GA4, however, a session starts with a session_start event, which generates a session ID associated with subsequent events.
3. How Sessions Are Calculated
Not only are sessions triggered differently in GA4, but how they are reported has also changed. GA4 uses statistical estimates to report the number of sessions, which Google claims to be more accurate and less prone to error. Because sessions are calculated and triggered differently between the two software, don’t be alarmed if your session count is lower when using GA4.
Now that we know how sessions are measured in GA4 compared to UA let’s take a look at how GA4’s events will impact your data and reports.
Types of Events in GA4

As we discussed earlier, everything in GA4 is now an event. To encompass all the previous Hits under Events, Google broke up the events into four subtypes: Automatic, enhanced measurement, recommended, and custom events. While these changes can seem intimidating, you will have more control over what you measure for your business once you get the hang of the new setup.
1. Automatic events are automatically recorded events in GA4, such as session_start, first_visit, and user_engagement.
2. Enhanced measurement events are preloaded events that can be toggled on or off easily and require no coding or adjustments. In UA, these events require using Google Tag Manager, but they are easily accessible within the GA4 platform.
3. Recommended events have recommended names by Google, but require custom code and parameters to be implemented for your site. Many times, these will require Google Tag Manager (GTM). A list of recommended events and how to implement them can be found here, but some examples are sign_up, add_to_cart, and join_group.
4. Custom events are likely the most intimidating because they are the most customizable and come with no set parameters or names. They will not appear in standard reports, so you must create custom reports to see their analysis. These kinds of events could be form_submission, button_click, or anything else you can create using GTM. Information on how to create and utilize custom events can be found by clicking here.
With such a significant shift in the measurement of analytics, it begs the question: “How will this impact the metrics I see on my dashboard?” Let’s take a look.
Types of Metrics GA4 Will Provide

Since the way sessions are triggered and how they record data have changed drastically, so have the engagement metrics many business owners and marketers use to gauge the success of their website.
In Universal Analytics, the Acquisition overview tab contains an overview of user acquisition and behavior data. Acquisition metrics include a breakdown of how users found your site, whereas behavior has metrics like bounce rate, how often a visitor lands on your site and leaves without viewing another page; page/sessions, the total page views divided by the total number of sessions; and the average session duration.

Traditionally, bounce rate is used to show the percentage of site visitors that left after viewing only one page, which is helpful to see if there are errors in the site that need to be fixed. Google Analytics 4 has completely done away with the behavior section and its metrics and instead focuses on the positive engagement metrics. These new metrics are based on engaged sessions, which Google defines as when a user meets one of the following criteria:
• Stays on a site for more than 10 seconds
• Completes a conversion event (view product, purchase, etc.)
• Has two or more page views
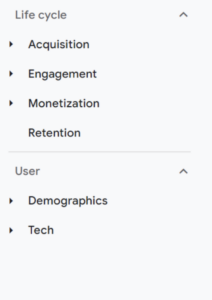
Under the acquisition tab, you can find metrics like total engaged sessions; engagement rate, how often an engaged session happens; engaged sessions per user; and average engagement time. So, while bounce rate is no longer a metric we can use, engaged session rate can be used to gather similar insights for you to review your site.

GA4 User Data Reports

Universal Analytics has tons of standard reports that can be run with your data under the reports tab on the left side of the screen. The reports are organized in the subcategories Realtime, Audience, Acquisition, Behavior, and Conversions. All the reports and data can be exported to third-party applications for further analysis or report creation. In UA, the data used to make these reports is stored for up to 26 months.


Google Analytics 4 significantly reduced the number of standard reports available. Data can be exported and run through a different platform like Google Data Studio. Another option is the new Explore page, where you can build advanced custom reports to suit your needs, like funnel and path reports. With that being said, there are limits to the number of explorations you can do with GA4. They allow 200 advanced reports per person and 500 per account property. With Google 360 Suite, however, you get 1000 reports per property.
On the bright side, GA4 directly connects with BigQuery, a Google service that stores and analyzes data. Unfortunately, the data retention in GA4 has been severely decreased, only allowing you to keep data for two or 14 months.
One of the many downsides of this shift is that, unless you have Google 360 Suite where data can be stored for 50 months, year-to-year data comparisons aren’t possible. So, take advantage of the link to BigQuery to save your data for later review. Even so, the only data being erased is user-specific, so standard reports can still be run from periods beyond 14 months. The only real effect will be a limitation on Exploration reports.
How To View and Filter Data in GA4

In the Admin settings of Universal Analytics, you will see three columns: Account, Property, and Views. In the View section, you can see your site’s data, filters, and goals. These allow you to view the data differently based on exclusions, such as excluding internal page views.

GA4 has done away with the Views section, instead replacing it with Data Streams. Data streams allow web and mobile app data to be seen together or separately. This is a single data view where filters can be added or removed to organize data. When getting familiar with Data Streams, it’s recommended that you filter out developer and internal traffic for accurate data.

How Will GA4 Impact E-Commerce Reports and Metrics?

In UA, e-commerce reports can be found under the Conversions section of Reporting to track monetary and non-monetary conversions of your site with metrics like transactions, revenue, conversion rate, average order value, and coupon usage. This was a great tool to view top-selling products, brands, and product categories and the revenue each brought in for the selected duration.
GA4 instead has monetization as a tool under reports, which is far more in-depth with the information it provides. Revenue, purchases, purchase revenue per user, coupon orders, best-selling items, and more can be found here. This feature also allows you to look at in-app purchases so comparison or aggregation reports can be made. While this section has loads of new terminology and features, the downside is that your website has to track direct monetary value for many of these reports to be inclusive. Currently, GA4 cannot directly sync up with services like Shopify without a more complicated setup than UA. While there is hope this feature will be added soon, it will be a nuisance to work around for the time being.
What Predictive Analytics in GA4 Impact Data and Reporting?

Not only will you be able to track e-commerce data with a bit of practice more efficiently and thoroughly, but the addition of predictive analytics using machine learning technology can help boost sales. UA currently builds audiences based on segments that had already completed an action or triggered an event.
Where the basis of audiences in UA is structured around users that have purchased an item or completed a similar action, GA4 can build a predictive dynamic audience. Using AI, the newest analytics software can predict when people might purchase an item, how much they may spend, and if they might stop shopping with you (sometimes called churning).
Machine learning technology can also assist in assessing the statistical relevance of data. Sometimes one user can complete an action that deviates so far from the norm that reports averages can be thrown off. GA4 has a feature called anomaly detection, which identifies these outliers so data and reports won’t be skewed.
What Does “User-Privacy” Focused Data Mean?

Google Analytics 4 was built with user privacy in mind. With data privacy and collection consent in the hands of the user, GA4 uses the same predictive AI mentioned above to make data more holistic. Even when a user might opt out of cookie tracking and data collection, predictive analytics can paint a picture of user data without infringing on anyone’s privacy.
Does GA4 Collect User IP Addresses?

Universal Analytics collects users’ IP addresses when interacting with a site. Any information recorded and analyzed by the analytics program is linked to a specific user and location, then stored for a data retention period of 26 months. While Universal Analytics doesn’t include IP addresses in reports, there are still ways to create custom reports and metrics to see user IP addresses.
To align with more secure privacy rights, GA4 no longer collects IP addresses from the users of their site. Granular data is still collected and shows information about the user’s city, but the precise location can no longer be seen. This granular data can be turned off by users of GA4, though the region and country of the user will still be collected. In addition to data being vague to protect user privacy, the retention period of this information is much shorter than before. Users can also request their data to be deleted, which can easily be done by the admin in GA4.
Here is a comprehensive report on data privacy compliance.
Enabling Google Signals for Reporting and Tracking

While many of these points may seem like limitations, the consequences of putting data privacy in the hands of users could actually benefit your business. When a business has Google Signals enabled, any data collected from users with ad personalization is automatically added to GA4 features. Google Signals is a product that allows for cross-device reporting and tracking for all devices where a user is signed in to their Google account. This allows for better cross-device remarketing and improved demographic and behavioral data.
A Quick Recap…

Let’s quickly go over some of the major shifts that you need to be aware of before we discuss how to make the shift from UA to GA4.
• Hits, Sessions, and Events: GA4 uses event-based analytics, making data collection highly customizable and efficient.
• New Engagement Metrics: GA4 focuses on engaged sessions and provides metrics on positive attributes compared to UA, which has metrics like bounce-rate.
• Content Reporting: While GA4 has fewer standard reports available, Explorations allow you to create advanced and customizable reports.
• Views vs. Data Streams: All data will now be in a single “view” but can be filtered and monitored by utilizing the new Data Stream tool.
• E-Commerce Metrics: Most e-commerce reports, now under Monetization, can only be created if your site tracks the direct momentary value of transactions; linking to services like Shopify will be more difficult to do.
• Predictive Analytics: Machine learning technology integrated into GA4 will allow for dynamic audience creation, more accurate statistics, and customer-journey prediction.
• User-Privacy: GA4 puts data sharing in the hands of the users, but predictive analytics and features like Google Signals increase data efficacy.
Should You Migrate From UA to GA4?

While you still have a little less than a year until Universal Analytics stops processing data, it may be a good idea to start migrating your data and information from UA to GA4 soon. As you can see, there are so many big and small shifts that may take some time to get used to. With GA4 relying so heavily on customizability to completely utilize the in-depth insights and reports, getting familiar with the layout sooner rather than later will help your business prepare and thrive for the massive shift in 2023. The shift is not optional, but your preparedness is!
How To Migrate Your Data From UA to GA4

With all the great new features available in GA4 and the approaching deadline to make the switch, it’s essential to know how you can migrate your data from UA. While the metrics aren’t all the same, using both programs concurrently until July 1, 2023, will help establish a baseline of data.
This Google support guide will help give you detailed instructions on migrating data and metrics from one UA to GA4 and provide additional in-depth information on some of the new features. The monumental shift in how businesses and marketers use analytics can be nerve-wracking, but having a firm understanding of the fantastic reports and features of GA4 can make this transition not only smooth but also beneficial.


