


Digital Marketing Analytics: A Simple Guide


Table of Contents


Digital marketing Analytics is more than just numbers on a screen; it’s the art of deciphering the language of user interactions across various online channels. Digital analytics involves systematically collecting, measuring, and analyzing data from websites, social media platforms, search engines, emails, and more. It’s about transforming raw data into actionable insights that pave the way for informed decision-making.
From website clicks to social media interactions, search queries, and opened emails, digital marketing analytics weaves insights from various channels. The comprehensive understanding of analytics enables marketers to create a unified strategy that resonates with their audience.
Understanding Website Analytics

In the ever-evolving landscape of digital marketing, understanding the performance of your content and website is crucial for refining strategies and maximizing impact. Metrics serve as the compass guiding your online presence, helping you decipher user behavior and tailor your content to meet audience expectations. Let’s take a closer look at common digital marketing metrics used to measure success.
1. Number of Website Visits
This is a fundamental metric. Imagine your website as a bustling storefront; the number of visits is like foot traffic. If your site welcomes 10,000 visits in a month, it’s akin to hosting 10,000 guests, each potentially interested in what you have to offer.
2. Time Spent on Site
This metric gauges how much time your visitors spend exploring your website. The average time spent on your website shows how much time visitors use to engage with your content.
3. Pages Viewed
Just as in a captivating novel, the number of pages viewed on a website reflects the depth of exploration. If a user views more than one page during a visit, it’s a positive sign of comprehensive interaction with your content.
4. Returning Visitors
This metric measures user loyalty, revealing the percentage of visitors who return for more. The formula for calculating this metric is (Number of returning visitors / Total number of visitors) x 100.
For example, If 2,000 out of 10,000 visitors are returning, the percentage of returning visitors is 20%.
5. Bounce Rate
This metric indicates the percentage of visitors departing after viewing a single page. A lower bounce rate is a positive sign that suggests visitors are interested in your content.
6. Average Page Views
This metric shows the average number of pages users view when they land on your site. The higher the page views, the higher the level of engagement.
7. New Visits
The number of new visits assesses your site’s ability to attract a fresh audience. It measures how well you expand your reach and make a lasting impression on those encountering your content for the first time.
8. Referral Sources
Understanding where your online guests come from is pivotal. Referral sources, whether from email campaigns or search engines, offer insights into the paths that lead visitors to your website.
Understanding Social Media Analytics

Running a successful campaign requires more than just catchy content and eye-catching visuals. It demands a keen understanding of how to measure and evaluate its impact. Here are key metrics you can use to measure social media success.
1. Number of Followers
Your followers are the backbone of your social media presence. A growing follower count indicates a positive trend, but don’t be fixated solely on the numbers. Pay attention to the quality of your followers — are they engaged, interested, and relevant to your brand?
2. Number of Active Users
Having followers is one thing, but having an active and engaged audience is a totally different thing. Active users are the ones who like, comment, and share your content. Their participation is a testament to the resonance of your message.
3. Number of Engagements
Engagements are the lifeblood of social media campaigns. Social media is not just about broadcasting your message; it’s about creating a conversation. Higher engagement rates indicate a compelling connection with your followers.
4. Reach
Reach is the measure of how far your content travels. It signifies the number of unique users who have seen your posts or ads. To enhance reach, consider the timing of your posts, the use of hashtags, and collaborations with influencers.
5. Impressions
While reach measures unique views, impressions count every time your content loads on a page. It’s essential to differentiate between the two. A single user may contribute multiple impressions, emphasizing the importance of crafting content that stands out and captures attention within seconds.
6. Click-through Rate (CTR)
CTR measures the effectiveness of your call to action. It shows the number of people who see your content and take a step by clicking on it. A high CTR indicates a compelling message that prompts action. Monitor CTR to optimize the placement and wording of your calls to action.
7. Conversion Rate
Clicks are valuable, but conversions are the ultimate goal. Conversion rate measures the percentage of users who click on a link and complete a desired action, such as purchasing, signing up, or downloading a resource. This metric provides insight into your content’s relevance and your funnel’s efficiency.
8. Cost per Action
Cost per action calculates the cost associated with achieving a desired outcome. It’s a holistic metric that considers both the overall campaign cost and the conversion rate. Keep a watchful eye on this metric to ensure your campaign is effective and cost-efficient.
Understanding Email Analytics

Monitoring and understanding email marketing indicators can help you refine your strategy, ensuring each email becomes a meaningful interaction in your digital journey. Here are some key email marketing metrics you should track:
1. Open Rate
This refers to the number of emails opened out of the total sent, revealing how well your subject line and snippet content capture attention. A high open rate indicates that your message stands out in the crowded inbox, while a lower one might signal the need for a more compelling approach.
2. Click-Through Rate
This metric measures the percentage of recipients who open your email and take an action like clicking on a link or button. A robust click-through rate suggests your content resonates with the recipients.
3. Unsubscribe Rate
The unsubscribe rate tells you how many recipients unsubscribe from your email list. A sudden spike might indicate that your content or frequency does not align with your audience’s expectations. Strive for a balance that keeps your audience engaged without overwhelming them.
4. Email Bounce Rate
The email bounce rate reflects the percentage of emails that couldn’t make it due to technical issues like firewalls or incorrect addresses. A lower bounce rate ensures that your messages reach the inboxes of your intended recipients.
5. Conversion Rate
This metric measures the percentage of users who complete a desired action after receiving your email, whether it’s purchasing a product, signing up for a webinar, or completing a survey. A healthy conversion rate means your campaign is creating interest and driving tangible results.
Understanding E-Commerce Analytics

The insights provided by ecommerce metrics reveal the state of your online store and inform future growth strategies. Let’s dive into some key metrics that are vital for e-commerce success.
1. Revenue
At the heart of every e-commerce venture lies the sweet sound of revenue—the total sum generated from selling your goods or services. This metric serves as the ultimate measure of your success, reflecting the financial impact of your online presence.
2. Conversion Rate
Conversion rate measures the percentage of visitors who make a purchase or engage in a desired action. Whether it’s completing a product purchase, signing up for a newsletter, or taking any other predefined action, the conversion rate is a critical indicator of how effective your website is at turning visitors into customers.
3. Average Order Value
This metric calculates the average amount spent per purchase, providing valuable insights into consumer behavior. By understanding how much customers are willing to spend in a single transaction, you can fine-tune your pricing and promotional strategies for maximum impact.
4. Number of Transactions
This metric provides a straightforward count of how many purchases are happening on your website. By tracking this over time, you can identify trends, understand peak purchasing periods, and assess the impact of marketing campaigns on transaction volume.
Understanding Lead Generation Analytics

Understanding the effectiveness of your lead generation efforts is crucial for the success of your business. Let’s look at the key metrics you should evaluate for lead generation.
1. Number of Leads
This metric provides a foundational understanding of your campaign’s reach and the initial interest it garners. For instance, if you launch a webinar, the number of leads would be the total number of individuals who register for the event or express interest by providing their contact information. If 500 people sign up for your webinar, that’s a considerable pool of potential customers actively engaging with your brand.
2. Lead Conversion Rate
While a robust number of leads is promising, the true measure of success lies in how many of these leads actually convert into customers. The lead conversion rate is calculated by dividing the number of conversions by the total number of leads and multiplying by 100.
3. Cost per Lead
Every lead comes at a cost, and assessing the expenditure involved in acquiring a single lead is vital for budget management. The cost per lead is calculated by dividing the total campaign cost by the number of leads generated, providing insights into the efficiency of your marketing spend.
4. Lead Quality Score
All leads are not equal. This metric delves deeper into the characteristics of your leads, considering factors such as demographics, user interests, and activity. Assigning quality scores will help you prioritize and focus on leads who are more likely to convert into satisfied customers and lead to a better conversion rate.
5. Return on Investment (ROI)
At the end of the day, what matters most is the impact on your bottom line. ROI is the ultimate measure of profitability for your lead generation campaign. Comparing the revenue generated against the total campaign cost is the best way to understand the campaign’s financial success.
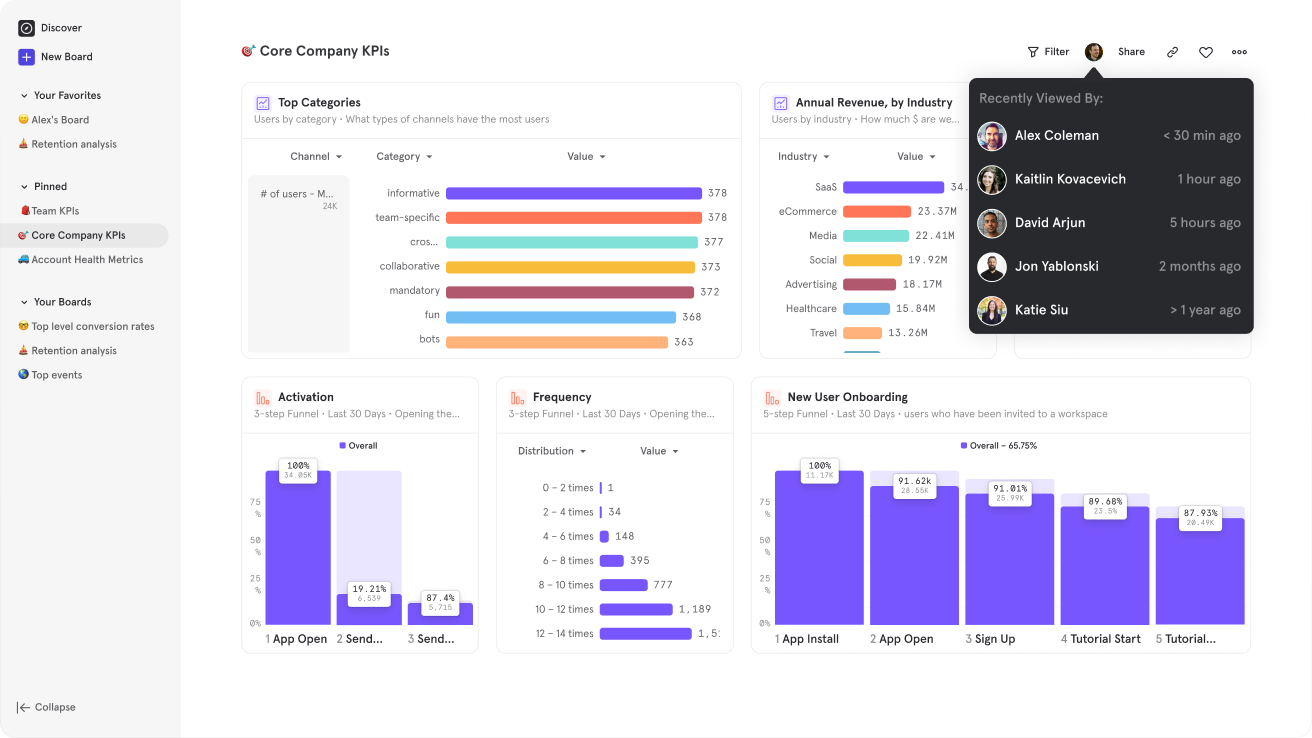
6 Key Tools Used in Digital Marketing Analysis
1. Google Analytics
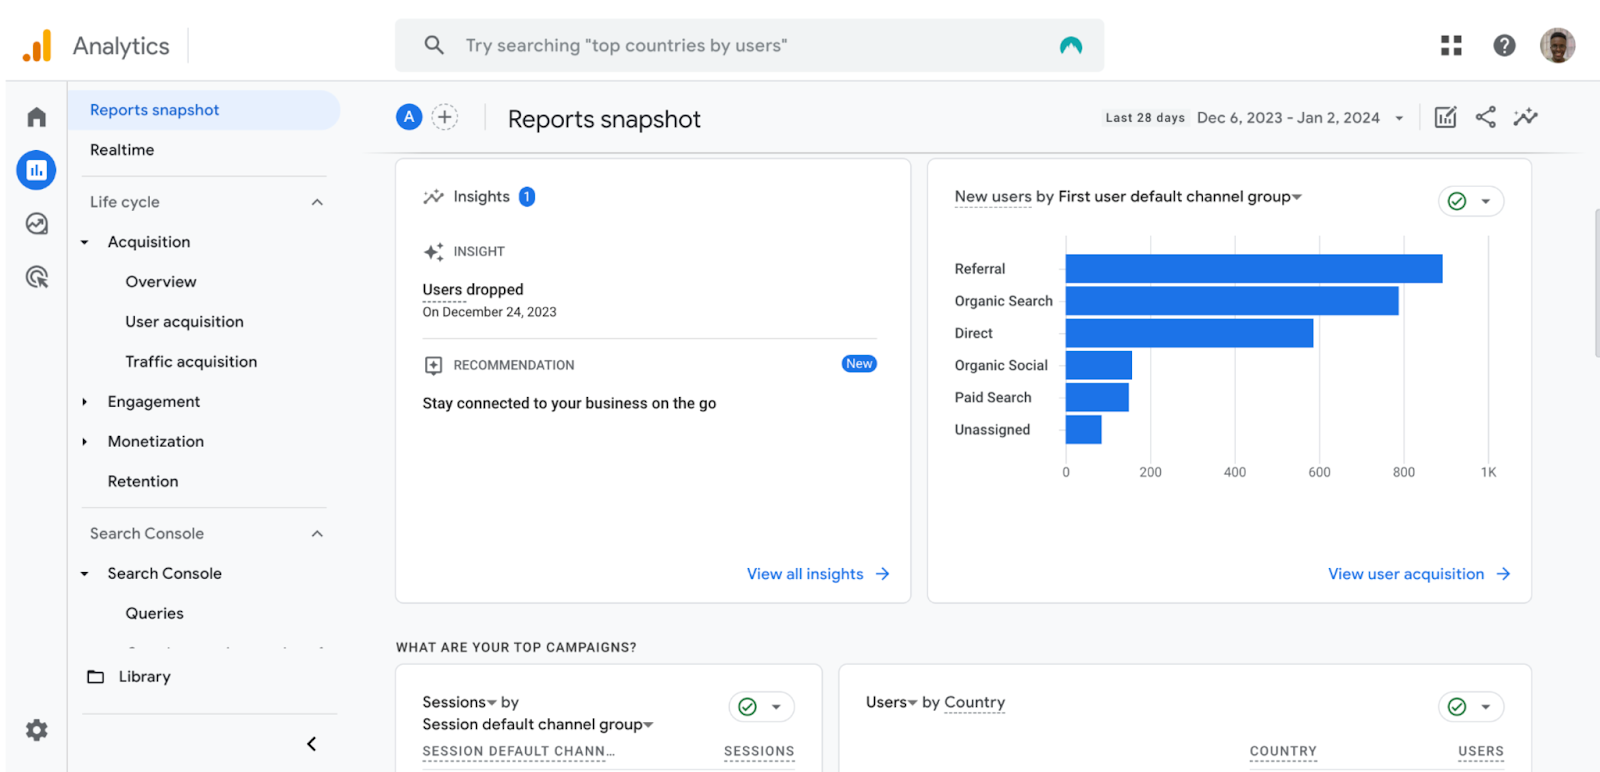
Google Analytics is a robust and free analytics service designed to provide comprehensive website analytics.
Features:
1. Tracks key metrics like page views, bounce rate, time on site, and conversion rate.
2. Enables goal setting and monitoring user behavior towards those goals.
3. Offers customizable reporting features, allowing the creation of tailored dashboards for tracking essential KPIs.
Read more about Google Analytics 4.
2. Semrush
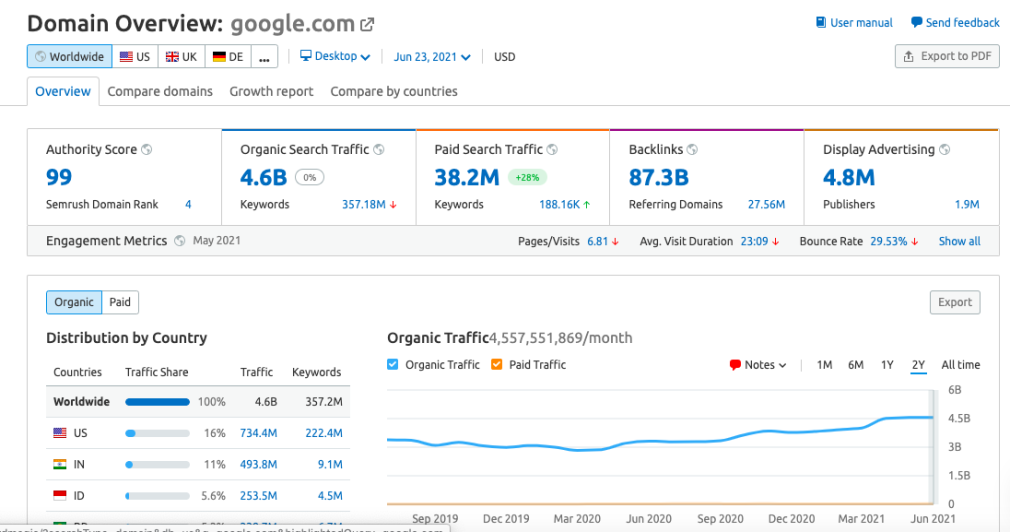
Semrush is a tool that empowers users to monitor website performance, analyze competitors, and optimize content for search engines.
Features:
1. Covers SEO, PPC, social media, content marketing, and market research.
2. Tracks website traffic, analyzes backlinks, monitors social media performance, and identifies key driving keywords.
3. Mailchimp
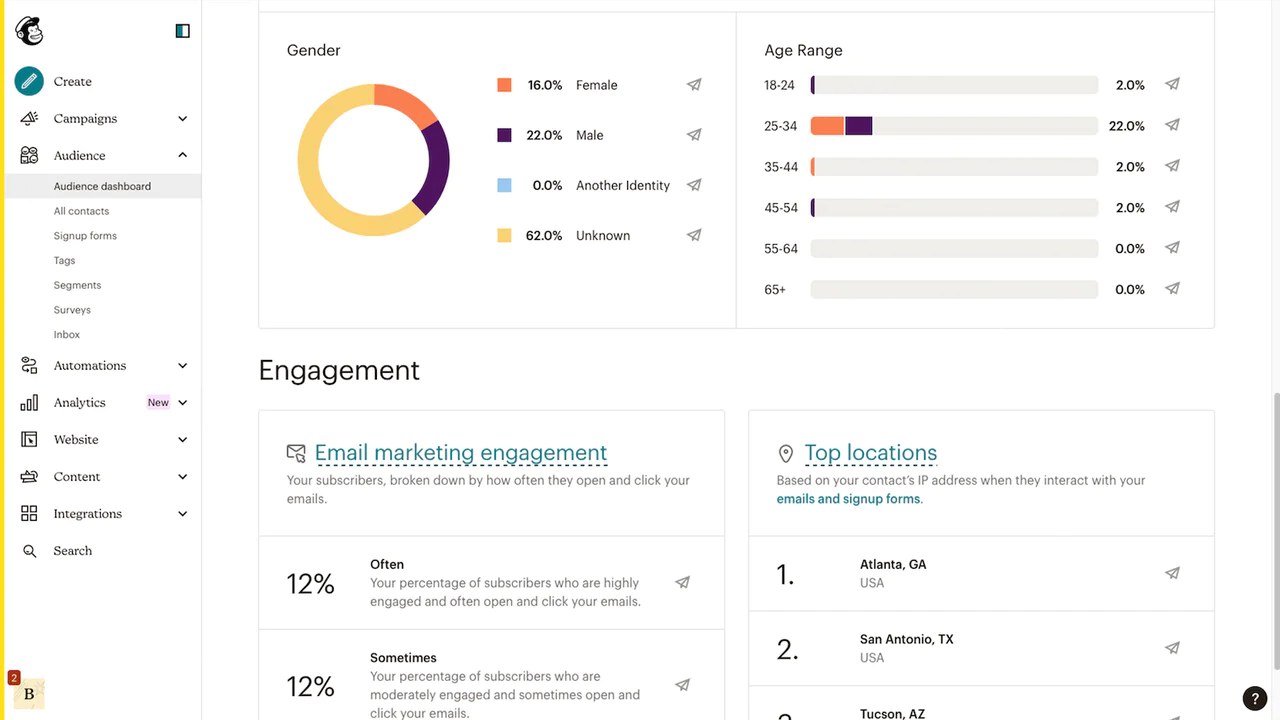
Mailchimp is a leading email marketing platform that facilitates effective email campaigns and offers robust measurement and tracking capabilities.
Features:
1. Tracks email metrics like open rates, click-through rates, and conversion rates.
2. A/B testing for optimizing email variations and identifying top-performing content.
3. Advanced segmentation and automation to send targeted emails based on user behavior.
4. Optimizes email marketing campaigns for improved user engagement and conversions.
5. Allows personalized messaging directly to customers’ inboxes for effective audience reach.
4. Moz
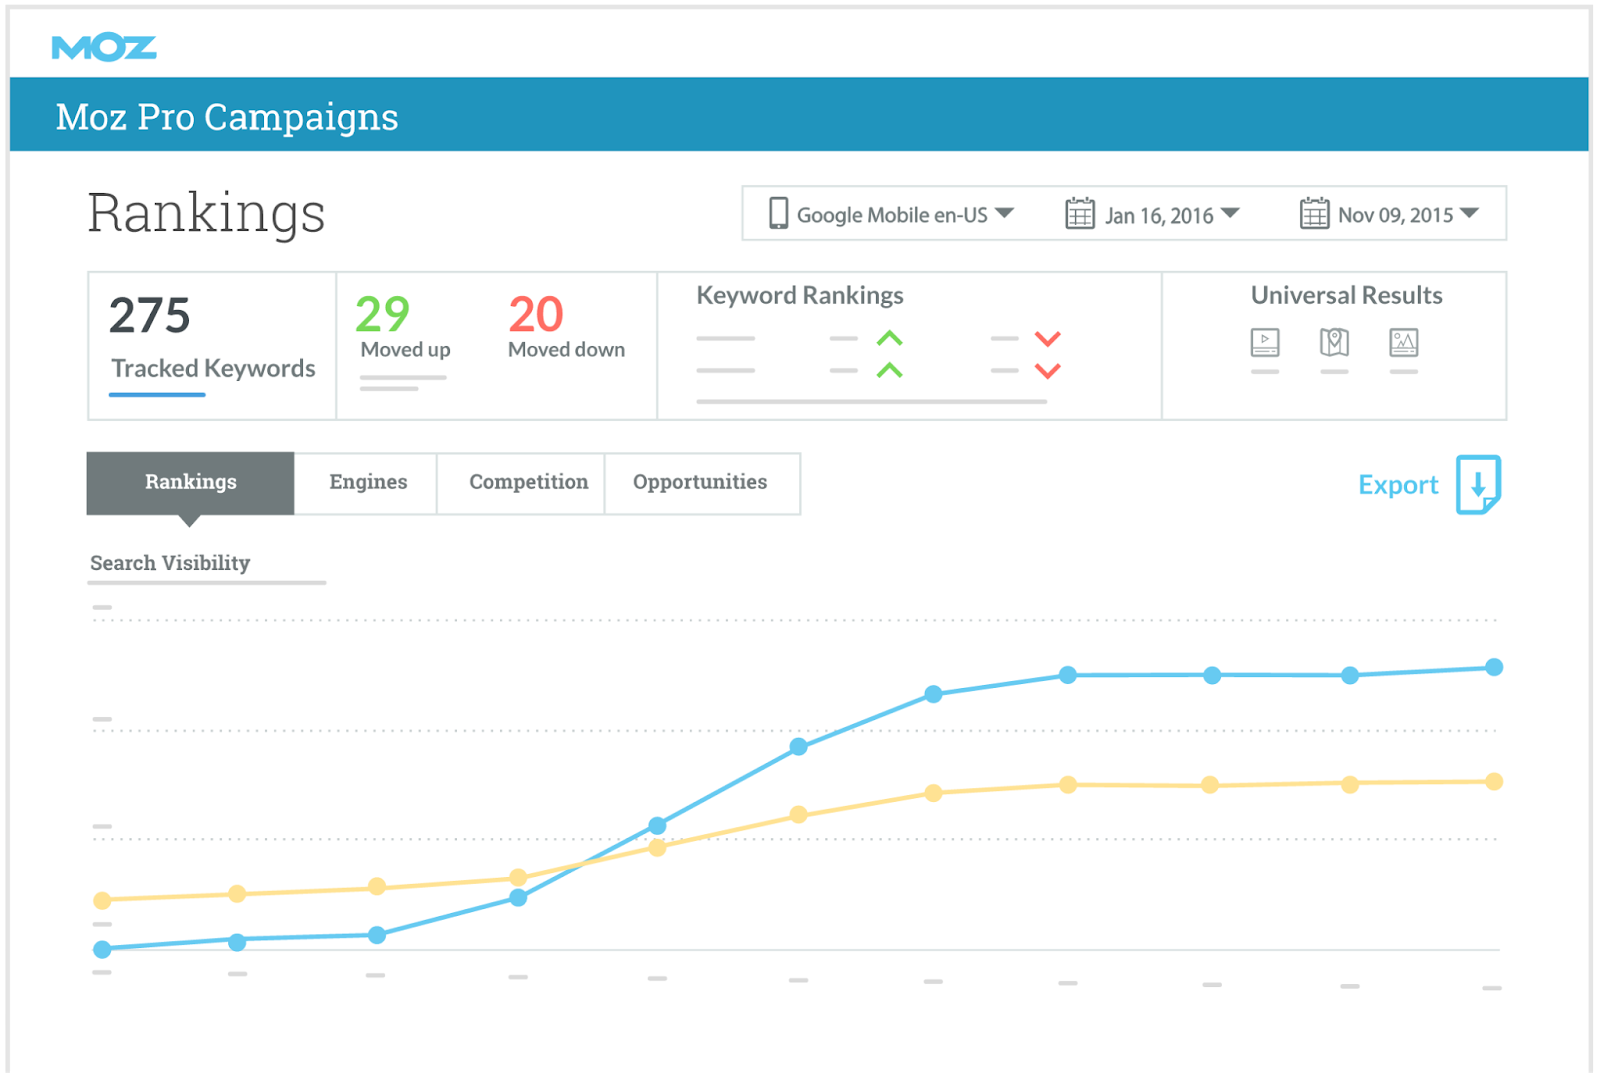
Moz stands out as a popular SEO tool, providing actionable insights and recommendations for elevating your website’s search engine rankings.
Features:
1. Offers comprehensive features like keyword research, site audits, backlink analysis, and rank tracking.
2. Introduces the unique Domain Authority metric, measuring your website’s strength and authority relative to others in your industry.
5. Mixpanel
Mixpanel is a powerful analytics tool with a focus on in-depth user behavior analysis for websites and mobile apps.
Features:
1. Tracks and analyzes user behavior, including actions, funnels, and retention rates.
2. Facilitates the creation of custom reports and dashboards, A/B testing, and setting up alerts for an optimized user experience.
6. Hotjar
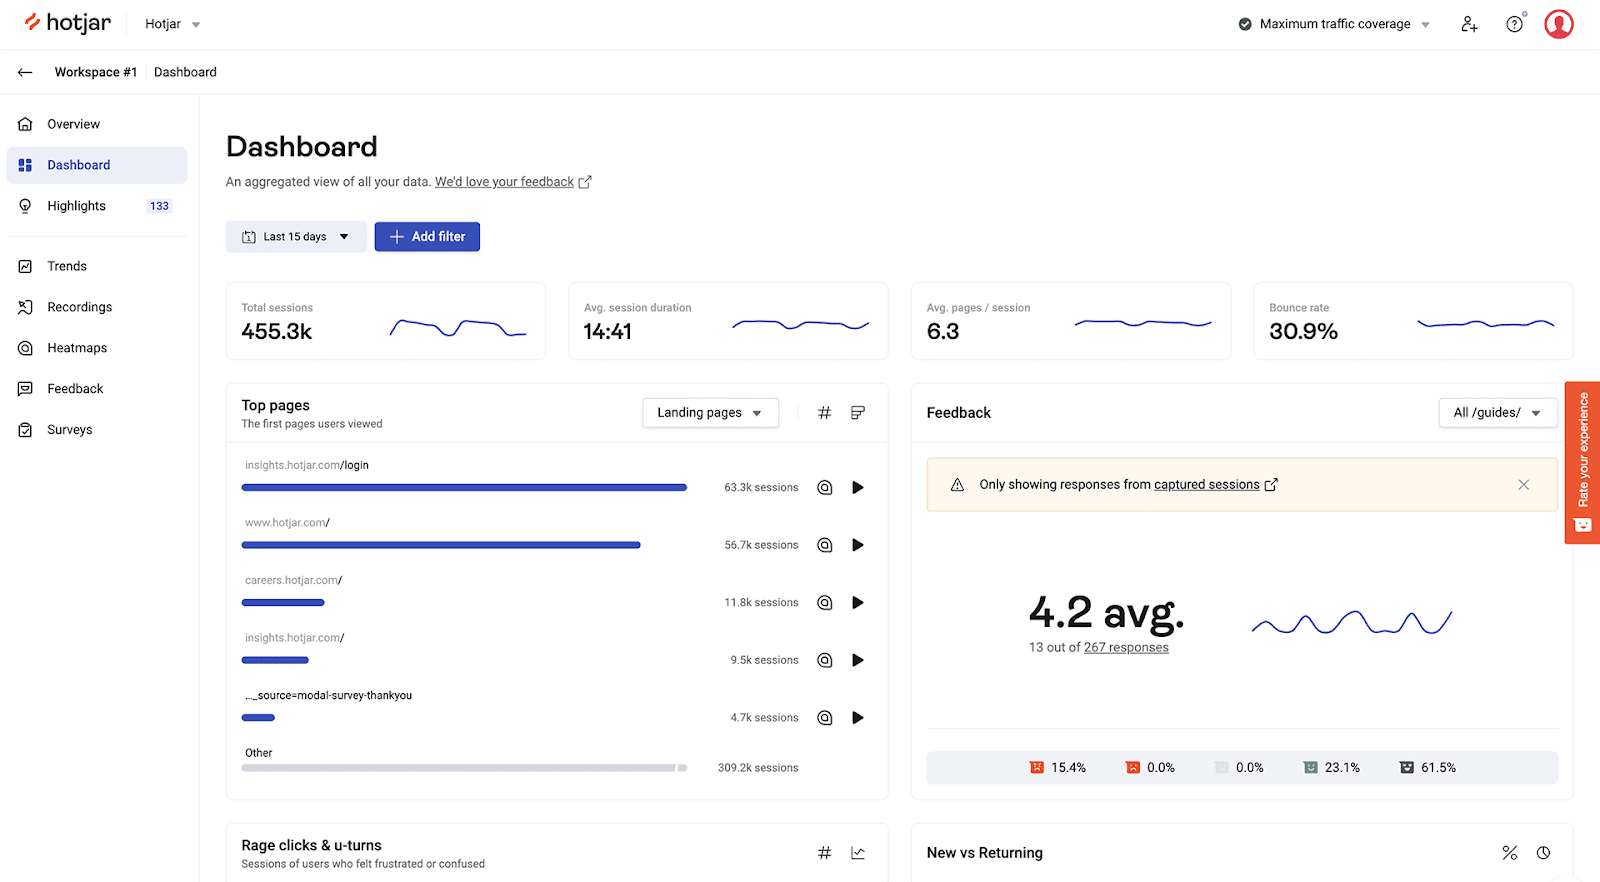
Hotjar is a user behavior analytics tool that provides insights through heatmaps, recordings, and surveys, enabling a holistic understanding of user interaction with your website.
Features:
1. Heatmaps visually represent user clicks, scrolls, and hovers, aiding in identifying popular areas and potential improvements.
2. Session recordings allow you to watch user interactions, revealing friction points and optimization opportunities.
3. Surveys facilitate the collection of user feedback, providing insights into preferences and needs.
Conclusion

Adopting and understanding digital marketing analytics has become indispensable for businesses that want to thrive in the competitive online realm. From deciphering user behavior to optimizing campaigns, the tools mentioned – Google Analytics, SEMrush, Mailchimp, Moz, Mixpanel, and Hotjar – exemplify the power of data-driven decision-making.
As the digital marketing landscape evolves, the synergy between data usage and analytics proficiency becomes paramount. It’s not merely about swimming in the vast sea of data but skillfully navigating it to extract actionable insights that propel campaigns to new heights.
Contact us today if you are looking for a digital marketing agency to help you navigate your digital marketing analytics. At SeedX, we understand the evolving dynamics of digital marketing and are well-equipped to help you integrate analytics into your marketing strategy.


